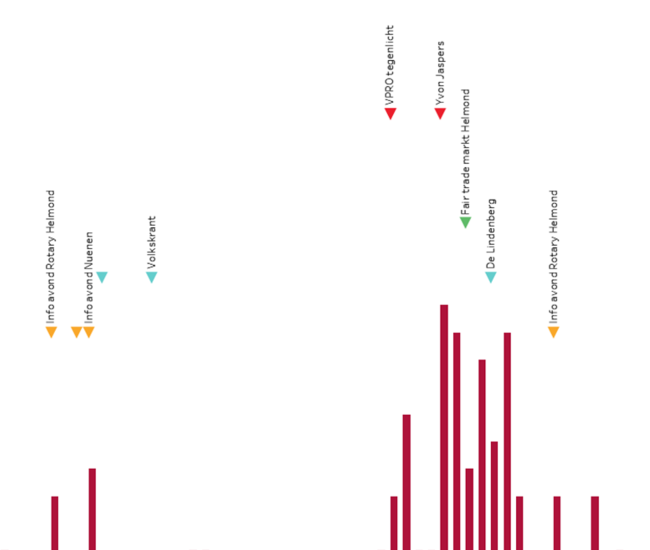
Activiteiten en aanmeldingen
Data storytelling
Numbers are never just numbers; Numbers tell a story.
And because a picture is worth a thousand words, it is very effective to tell a story with images.
In data story telling I will most often use graphs and diagrams to illustrate the story.
In contrast to information visualisation, where the data are dynamic and need regular updating, in data story telling the data are fixed. This can be the case when a research has been conducted and the results are in. The next step is to present the results in a meaningful way.
Another difference with information visualisation, is that in data story telling there is usually no option for the audience to interact with the visuals to zoom in or filter. The story is ‘read’ by means of the presented images.
Every story has a beginning, a middle and an end. The same goes for a data story. With a client I work on the story line, and work out the most effective and valid way to tell the story to a particular audience. Then I design the graphics to tell the story.
Data story telling fits perfectly in published or presented reports like annual reports, conference presentations or journal articles.

Data storytelling